Market Review Crude Week 19
Hi everyone
Last week we saw a little retracement on crude, on the Friday's session the price hold the level 44,00. In a nut shell, nothing on the chart and change it any continues bullish.
Dollar Index:
If the Crude remains bullish, This chart remains bearish and now the price rebound from the 0.382 Fibonacci Level and Present from the 92.00 level.
The price is in the basis of the bearish trend and we can expect a move to 95.00 is obviously the first resistence 94.00 if the price move higher the next level will be 96.00 and frome esta level we can see new lows.

VIX:
Actually the price in a range. Above 17.00 will be the first clue to see new highs, and end the signal will be a close above 19.00 level.

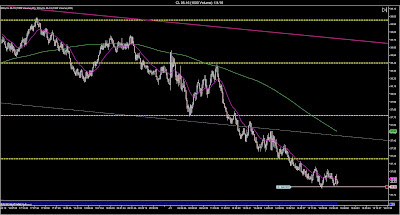
CL M:
In This chart we can see a clear resistence on 46.50 if the price close above 47.00 two days I expect that price to reach 50.00 in short time.

CL W:
Price is moving in a up trend and is now above the 50 moving average, and the first resistence este. Meanwhile we do not see a close below 40.00 the chart is very bullish.

CL D:
A close look to the chart shout us Important That We Have a resistence at 42.00, 40.00 and below we find this is a resistence Important too, there will be 50 EMA 200 EMA and to figure 40.00.

As you can see, there is no reason to think that we'll see to new highs in the coming week. But, if we see a new highs in the VIX we can see a retracement in the crude market to the level 42,00 or 40,00. So we will have to keep an eye on this chart.
Good Bye and Good Trading.


Comentarios